

Last updated by C. Kolb, 2 April 2026
How to use Metrisim's experimental design module for conjoint analysis
This module generates an experimental design that you can use to create product profiles to show respondents in a survey.
The type of design typically used in conjoint analysis is a fractional factorial. It is called a fractional design because on a fraction of the possible combinations are shown to respondents to reduce work load. You don’t have to worry though since a model is used in the simulator that allows us to estimate the impact of combinations not shown to the respondent. Typically an algorithm is used to find such a design by optimizing a criterion such as d-efficiency; as is the case in Metrisim.
1. Decide on what attributes and levels to include
This is the only file required as input for the design module to work. This tells the design module what attributes and levels define products in your market.
You won’t be able to cover all attributes usually, unless it is a simple product, and so you should focus on the attributes and levels that are both important in your view, and simultaneously are within your organization’s power to alter.
For instance, in the case of the UHT milk survey - used as a demo within Metrisim - it was decided that all fat grades (full cream, skim etc.) would be offered on the market; and so there was no point in including fat grade as an attribute. Instead respondents were told to simply assume they were buying their preferred fat grade. The package images were even altered to remove any references to fat grade to avoid having to vary this across product profiles.
So what is the maximum number of attributes and levels? The traditional guideline in the literature is to have around 6 to 7 attributes maximum as a starting point; but to be more precise calculate the total number of combinations - the max. allowed is 5000 in Metrisim at present. E.g. If you have 5 attributes with 4 levels each, this is calculated as: 4 x 4 x 4 x 4 x 4 = 1024 possible combinations. Metrisim then selects a subset of these to generate a fractional factorial design using the d-efficiency criteria.
2. Prepare attribute map
A new beginner friendly attribute map generator is included, as of the 21st of April 2026. It allows you to add attributes and levels via the GUI, while checking for errors.
Alternatively you can still create in a spreadsheet and upload a attribute_map.csv file. This is described in more detail in the setup files tutorial, place the attribute names in the first row, and under each, its corresponding levels. Save as a csv file, preferably UTF8 if the option exists in the software you are using.
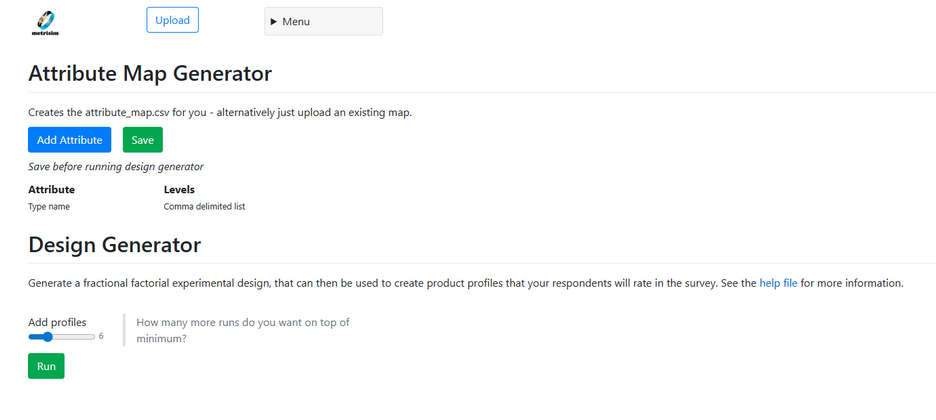
3. Upload and run
Once you login you will automatically be directed to the simulator, as you will tend to spend more time here than with the other modules. So select the menu and then select Designer.
If you haven’t already, upload the attribute_map.csv.
Metrisim’s designer module automatically estimates the minimum number of product profiles (runs) needed. However it is usually advisable to add a few extra runs; you can indicate how many using the slider. This is especially necessary if you wish to make use of the respondent R squares for quality control in the estimator module later on.
Click run to start. Metrisim uses a Federov algorithm to find the best possible D-efficient design within a reasonable amount of time. It does this using the dummy coded design matrix for a full factorial as a starting point. It is important that this is done on the dummy coded matrix and not a categorically coded matrix (as the final design_text.csv is) as there is typically no quantitative meaning, even in the case of price which has its own special treatment in a metric conjoint analysis context - where instead of a single partworth being estimated for price, a partworth is estimated for each price point, which is then used in conjunction with interpolation in the simulator.
Once it has run, assuming you didn’t receive any error messages requiring corrections to your file, you will see the first few lines of the design_text.csv file shown on screen. If you rerun, you will notice it gives the same result. This is a feature of Metrisim, in that it ensure repeatability by using the same seed for the pseudo-random number generator used for the first step in the algorithm.
You can select download and then click on the link that appears to download a zipped file containing the design and another file indicating the correlations between the level dummy codes. Ideally you would prefer designs with lower correlations between the levels of different attributes; while large correlations between levels of the same attribute are to be expected as they are mutually exclusive.
3a. Unacceptable level combinations or missing expected profiles
The usual advice is to not alter the design file generated by the Federov algorithm as you may potentially increase correlations between attributes, resulting higher standard errors. However, a specific combination of levels may sometimes be considered unacceptable from a human standpoint, even though statistically there is no problem. Alternatively, your client may expect an exact representation of an existing product, and may find its exclusion disconcerting. If either of these apply, here are the steps to take:
- Download the design_text.csv to make manual modifications.
- If unacceptable level combinations - change the offending level to something that makes sense (avoid duplicating other existing profiles by accident when doing this). If an expect profile is missing, add a row with this profile. In both cases, you must use the levels listed in your attribute_map.csv - if you find you need a new level, then you will have to start from the beginning and upload a new attribute_map.csv and rerun the design generator first.
- Remember to also change the product profiles you include in your survey tool.
- Don't forget, you will need to upload this updated design_text.csv file when running the 'estimator' module after the survey completes.
- Keep notes of the changes made, and also keep a copy of the original design file in case you attempt to rerun the design module later, forgetting that you made the changes.
3b. Balance
While the Federov algorithm aims to return a design with the highest possible D-efficiency given the run limit you impose, it may at times have poor balance. For example an attribute level only appears once while the other levels within the attribute appear 3 times each. In such a case you can either add a row or two to the design file to compensate, or modify one or more of the existing profiles with excess levels. However, try to keep this to a minimum as you potentially increase correlations (strictly speaking ‘dependence’) between levels across attributes (of course within an attribute they are expected to be negatively correlated).
4. Automatically generated questionnaire text
The download now also includes an automatically generated questionnaire section to save you time; just copy-paste into your favourite survey tool. For instance, you can easily use this with Pollfish - a survey tool with its own built-in audience - see this article to see how. This questionnaire section is intended to be the 'bare minimum' required to get the ratings required by the estimator module. The basic probability scales included in the text would work with a 'numeric' question type; you should restrict the range to 0 to 10 (the scale is defined in the question wording as opposed to within the scale points themselves). Alternatively use something like a 'Juster scale' where the scale points have verbal labels; a Juster scale could be used with a 'radio button' question type or any type that restricts response to a single option on the list (just make sure there is a way to export numbers than the verbal labels as Metrisim expects rating in the 0 to 10 range for each profile).
Tip: do not give any one attribute prominence prior to the conjoint ratings, as respondents tend to focus on this attribute and importance is over-estimated.
Example
If you are having issues viewing this video on YouTube click here to view on site instead.
Copyright reserved, Craig Kolb, 2025